

July 22, 2026
Summary: In this tutorial, you’ll learn how PostgreSQL internal statistics (pg_stats) work and some optimization guides.
Table of Contents
Core Concepts
When generating an SQL execution plan, the Query Planner does not directly scan raw data tables; instead, it relies heavily on database statistics. These core statistics are stored in the pg_statistic system table, while pg_stats serves as a human-readable view built on top of it. (Note: In PostgreSQL naming conventions, plural forms usually represent views, whereas singular forms indicate actual system tables).
Key Metrics in pg_stats
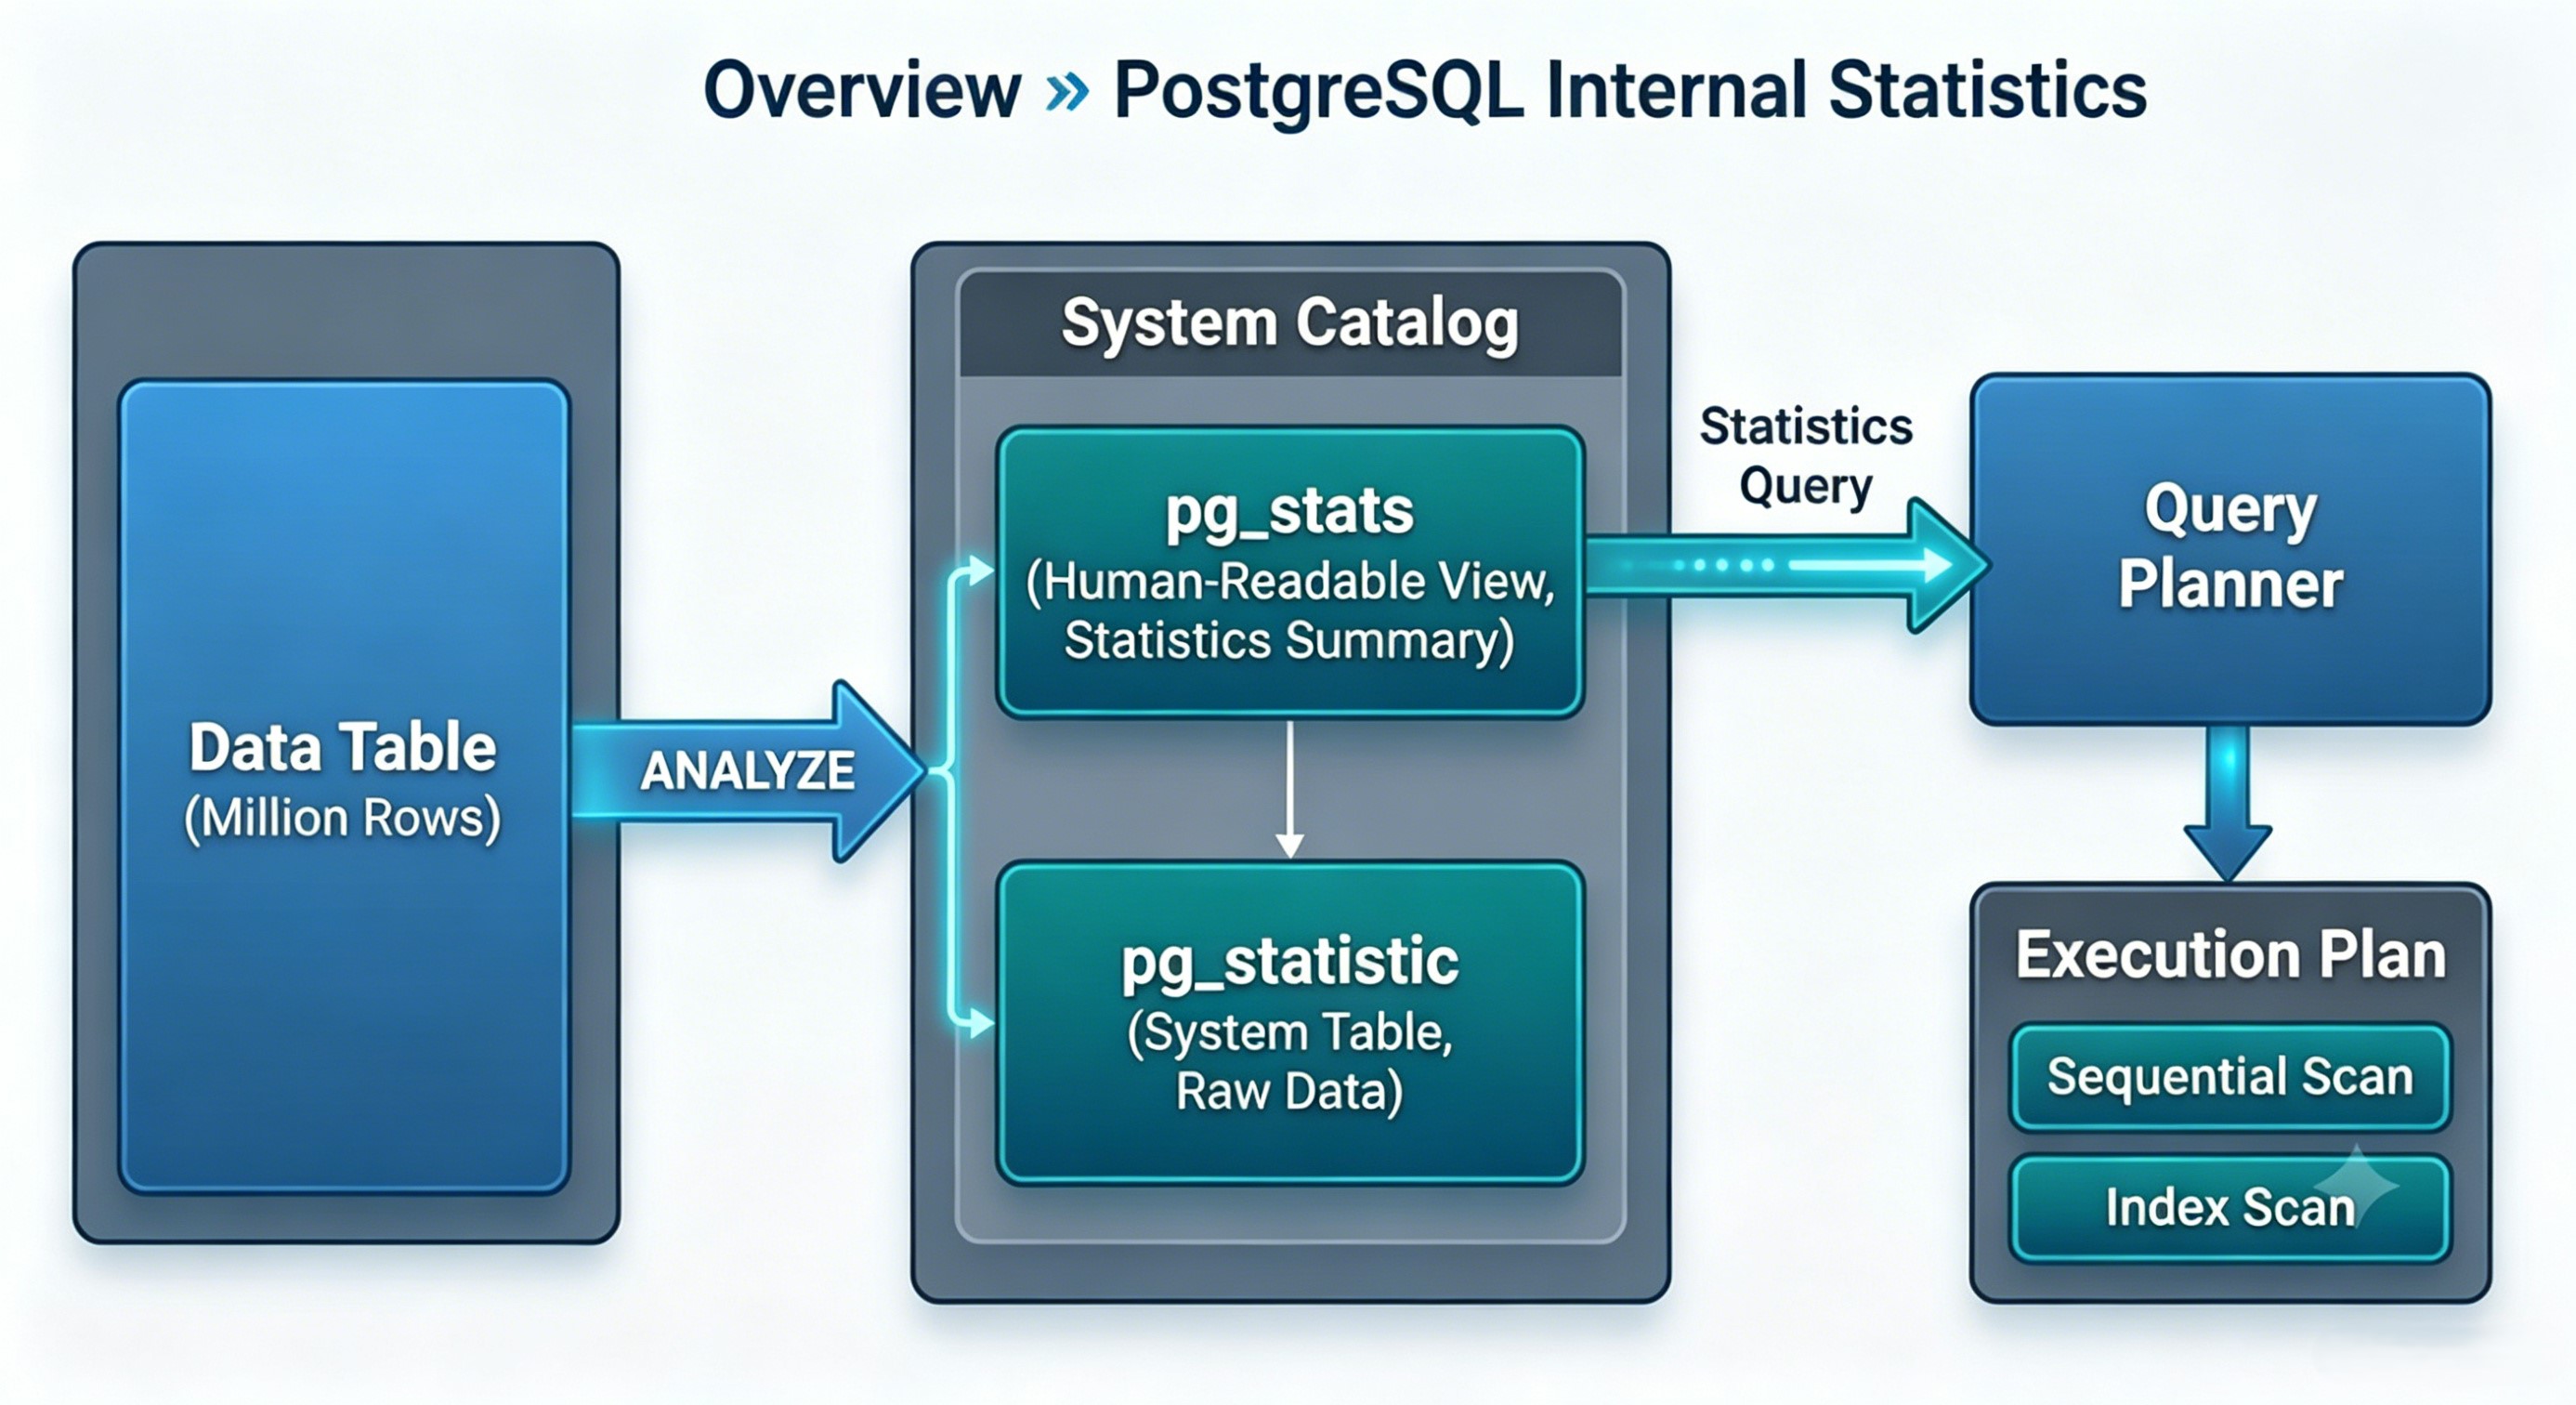
When you execute the ANALYZE command, the system scans the table data and populates the following key statistical indicators:
-
n_distinct(Number of Distinct Values): Measures the count of unique values in a column. For a primary key (where every row is unique), this value is specially represented as-1. -
null_frac(Null Fraction): Represents the percentage of rows where the column value is null. -
correlation: Indicates the physical ordering of data stored on disk relative to logical column values, ranging from -1 to 1.- Close to 0: Data is physically distributed randomly. The planner leans toward a Sequential Scan to avoid high random-read overhead.
- Close to -1 or 1: Data is highly ordered on disk, making the planner more inclined to choose an Index Scan.
-
most_common_values(MCV) &most_common_freqs: Records the most frequently occurring values in a column along with their percentage frequencies. This helps the planner accurately anticipate data skew.
Cost Calculation & Scan Methods (Index Scan vs. Sequential Scan)
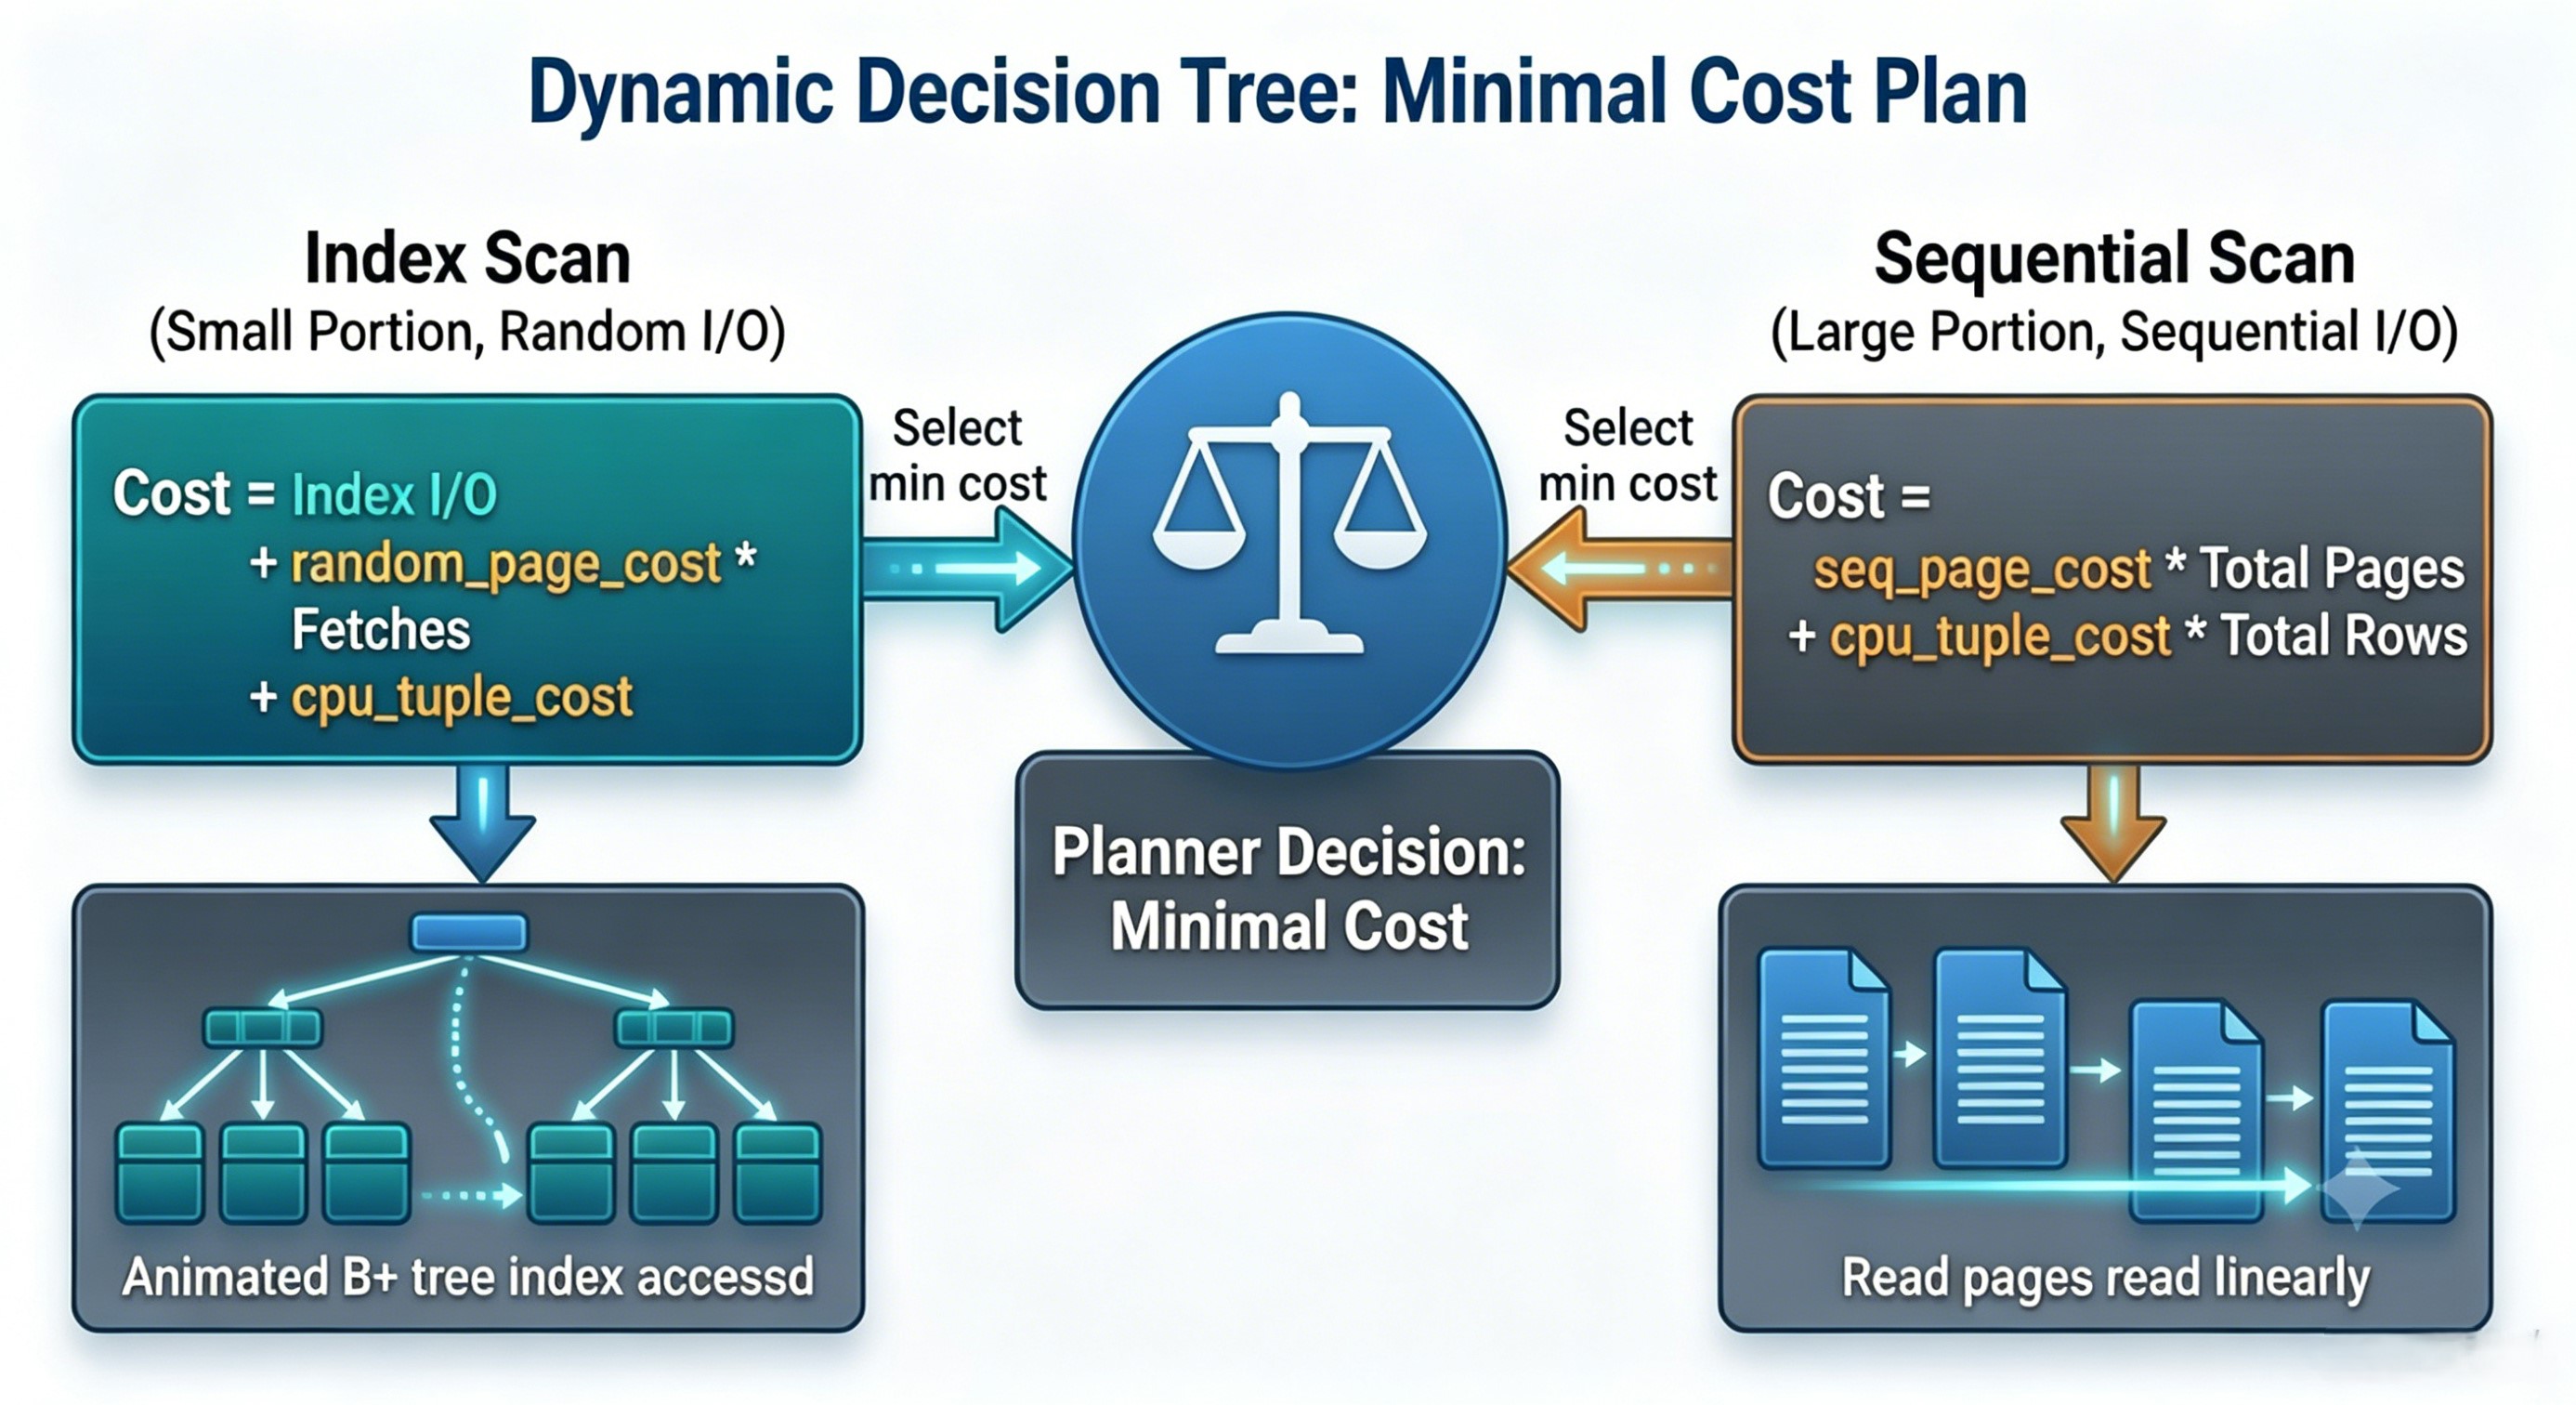
The Query Planner determines which scan method to use based on a mathematical “Cost” model, which includes three core cost parameters:
random_page_cost: The cost of fetching a random disk page (commonly used in index scans).seq_page_cost: The cost of sequentially fetching contiguous disk pages (commonly used in sequential scans).cpu_tuple_cost: The CPU cost required to process a single row (tuple).
💡 Key Comparison: Why does a query trigger a full sequential scan even when an index exists? If a query condition matches a large portion of the table (e.g., 20% of total rows), performing tens of thousands of “random page fetches” through an index in a million-row table consumes significantly more CPU cycles and time than reading the entire table sequentially from start to finish. Thus, the planner determines that a sequential scan is cheaper. Conversely, when a query condition targets a very small subset of rows (e.g., rare values), the planner decisively chooses an index scan.
Advanced Optimization Strategies
Default statistics may fail to accurately capture complex data distributions. In such cases, you can apply two advanced tuning strategies:
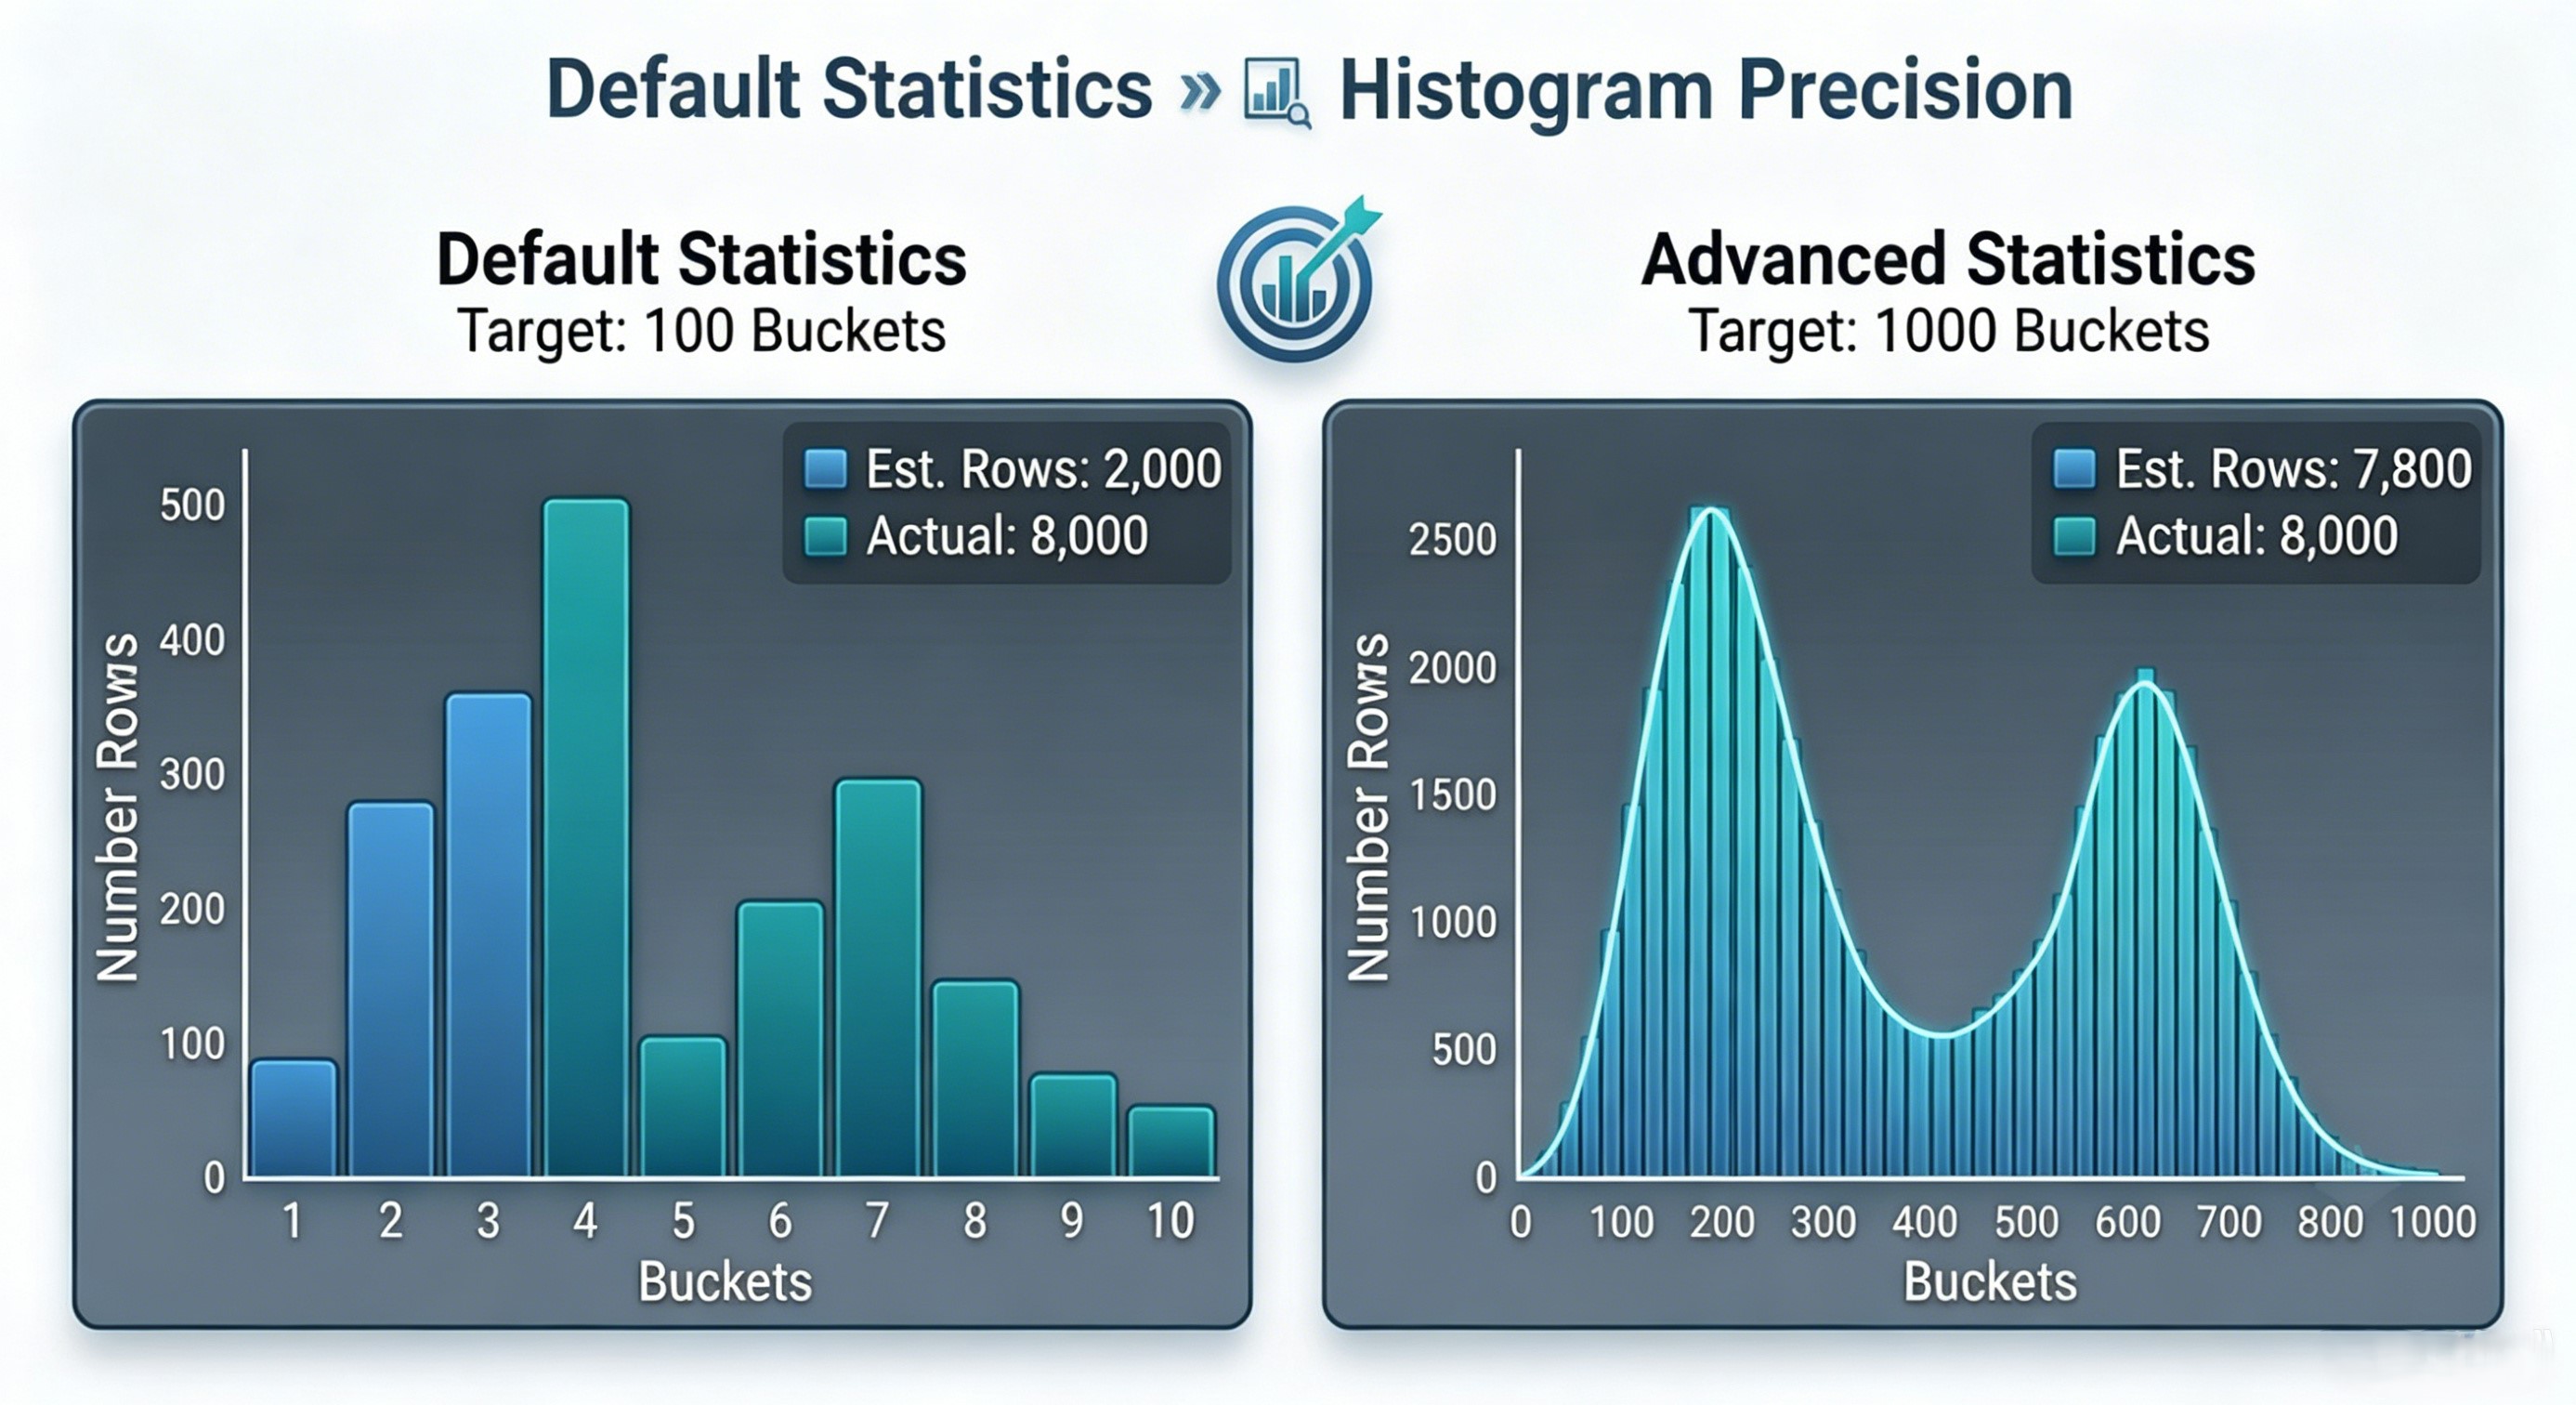
1. Adjusting Histogram Precision
- Use Case: Range queries involving date/time intervals or numerical ranges.
- The Issue: PostgreSQL collects 100 histogram buckets by default, which can lead to statistical inaccuracies for fine-grained range queries.
- Solution: Use
ALTER TABLE ... ALTER COLUMN ... SET STATISTICS 1000to increase the statistics target for a specific column to 1000 or higher. - Note: Higher precision increases
ANALYZEexecution time; it is recommended to adjust this on a column-by-column basis rather than globally.
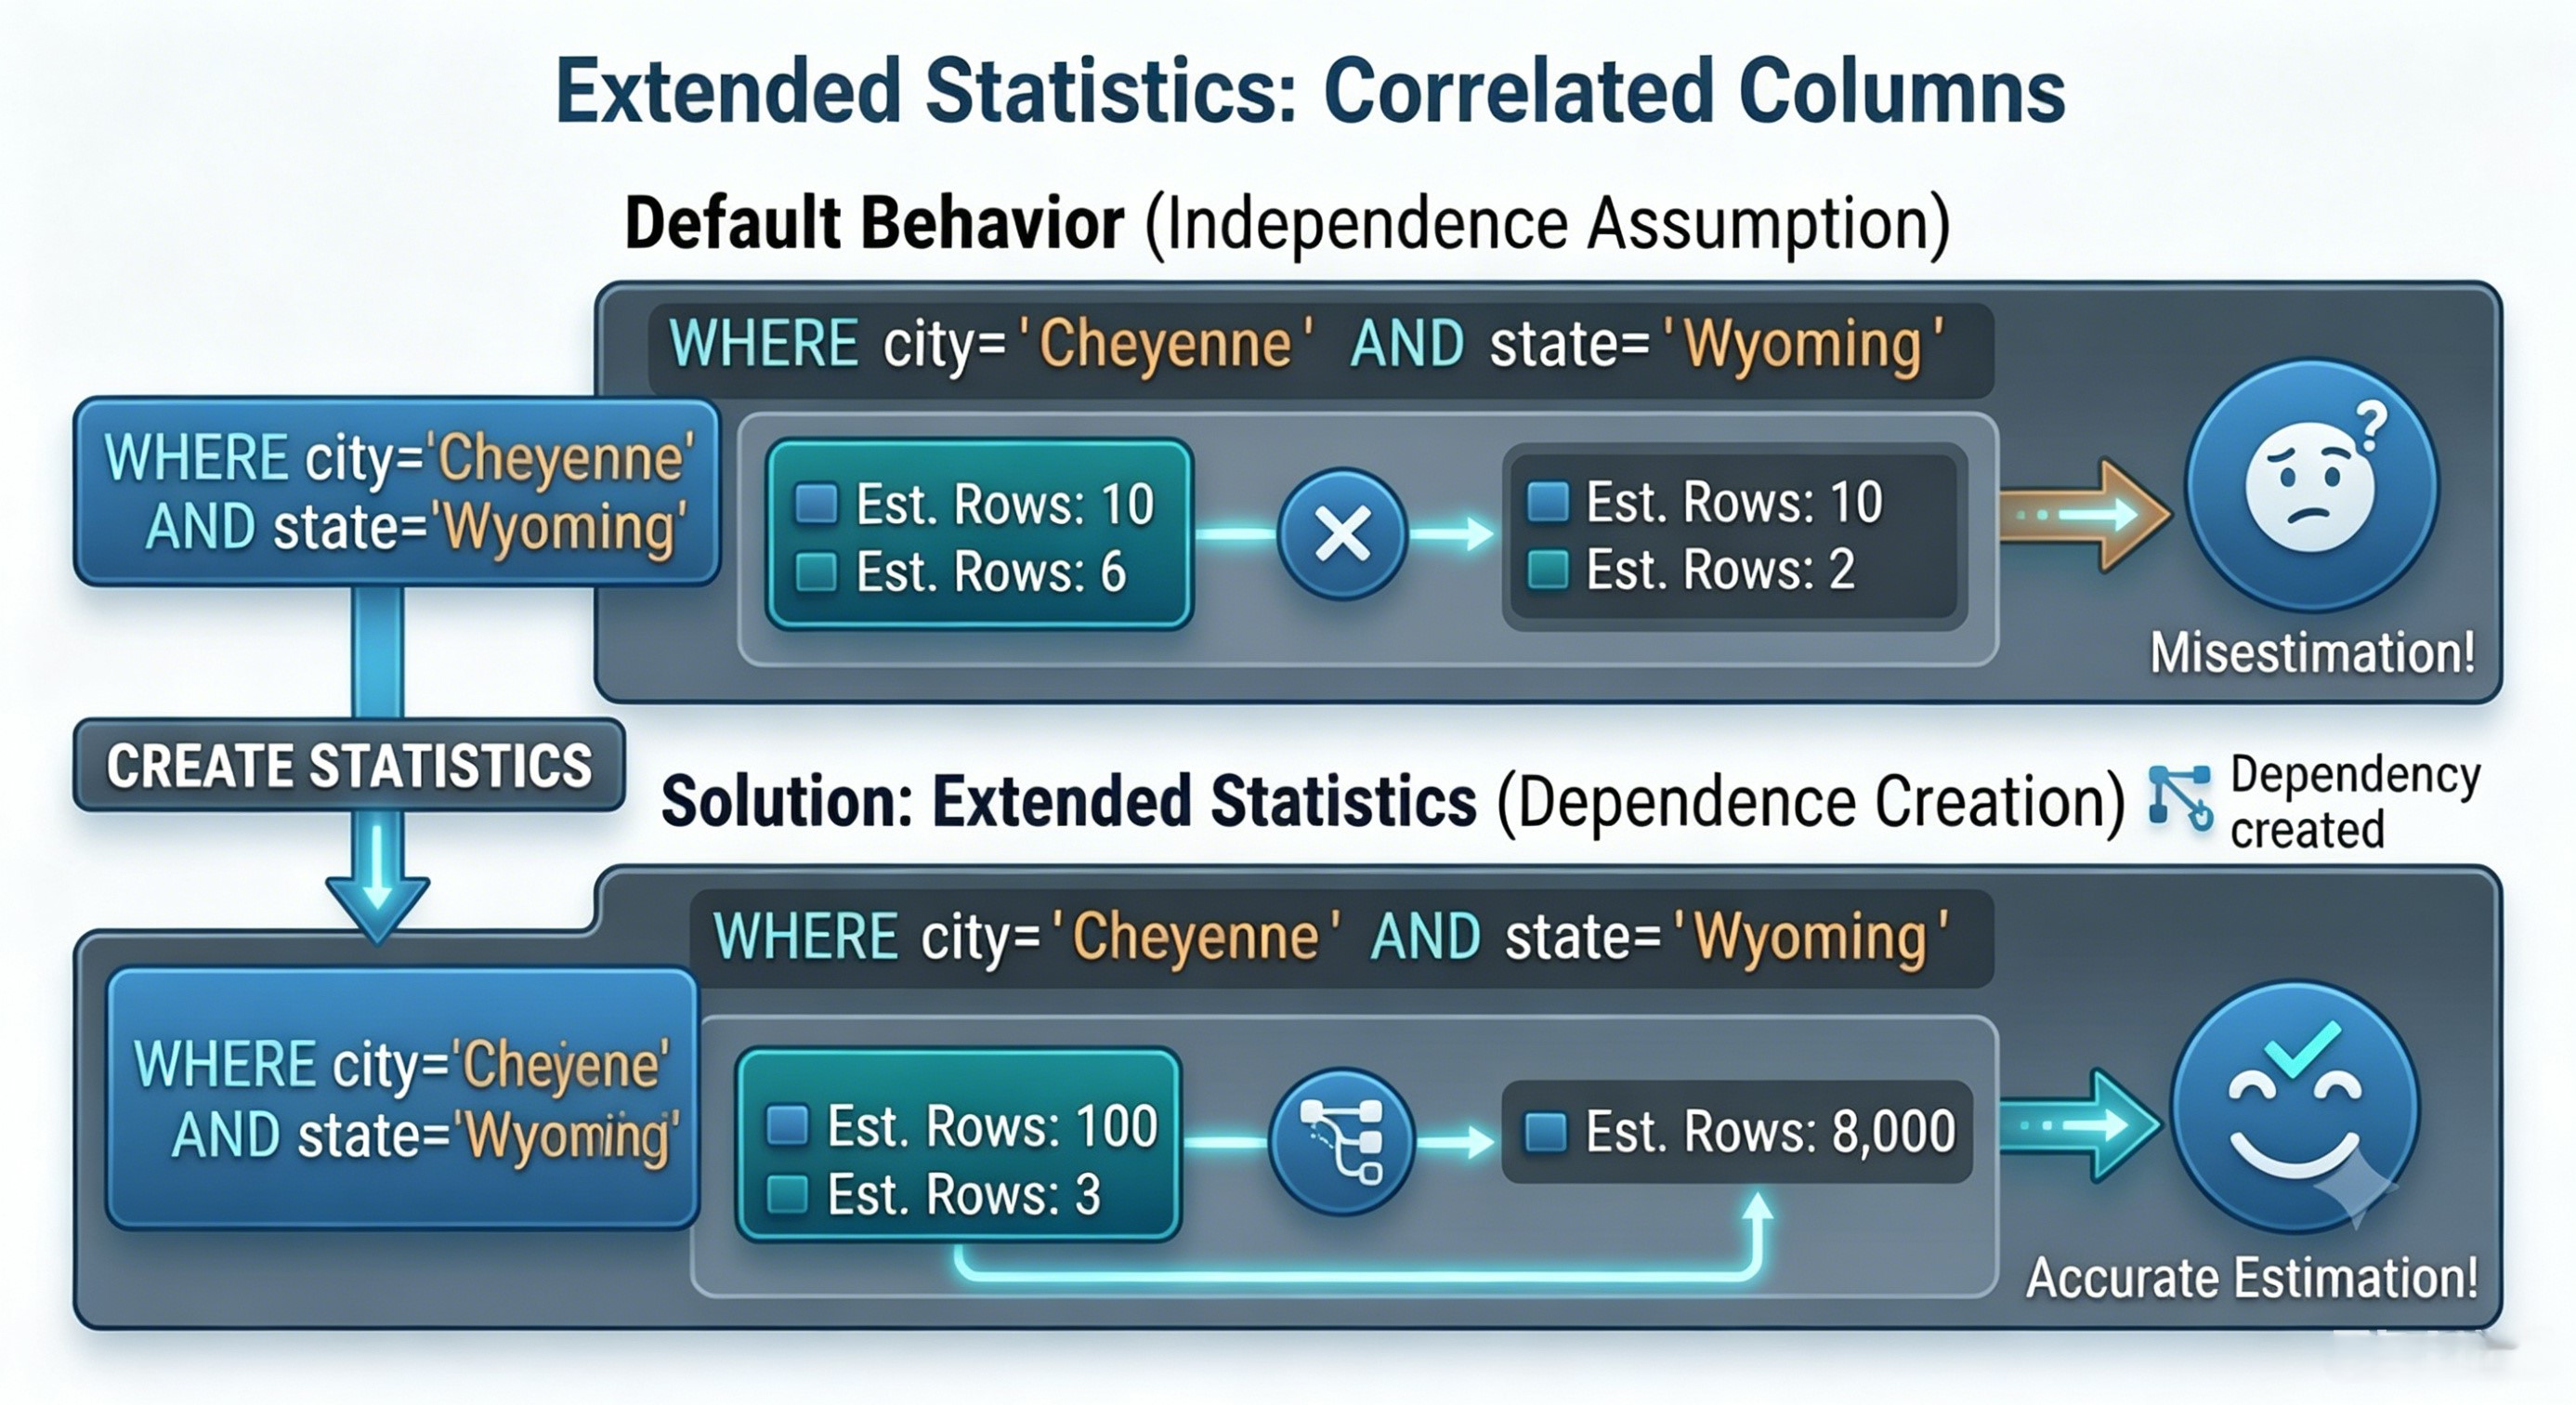
2. Creating Extended Statistics
- Use Case: Joint queries with strongly correlated columns (e.g.,
city = 'Cheyenne'ANDstate = 'Wyoming'). - The Issue: By default, the planner assumes column conditions are independent and multiplies their individual probabilities, severely underestimating returned row counts.
- Solution: Use the
CREATE STATISTICScommand to explicitly declare dependencies between columns, enabling accurate multi-column selectivity estimates.
6-Step Slow Query Troubleshooting Checklist
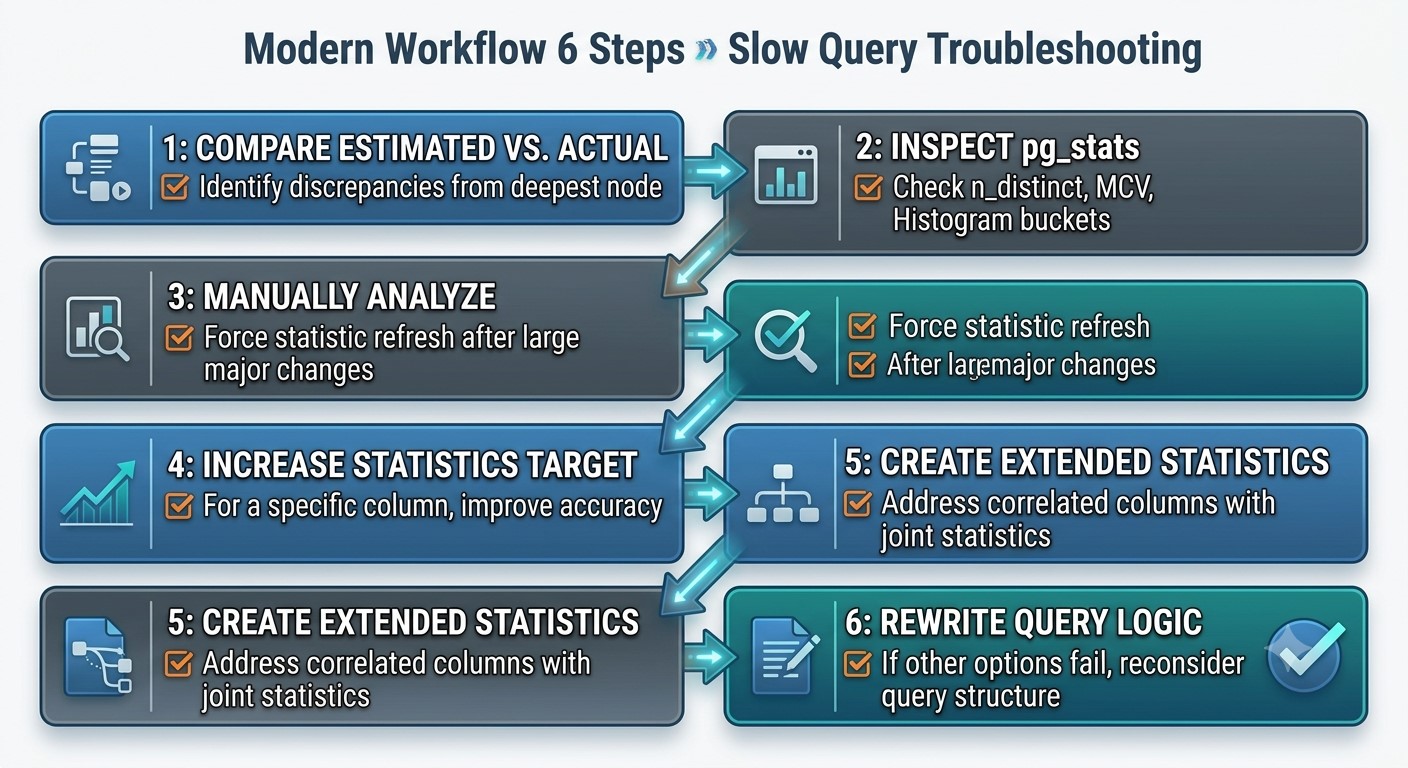
When queries perform slowly or behave unexpectedly, follow this 6-step troubleshooting workflow:
- Compare Estimated vs. Actual Rows: Run
EXPLAIN ANALYZEand look for significant discrepancies between estimated and actual row counts, starting from the deepest plan node. - Inspect
pg_stats: Checkn_distinct, most common values (MCVs), and histogram buckets for the target columns to verify if they match your actual data distribution. - Manually Run
ANALYZE: Especially after large batch loads or migrations where autovacuum/auto-analyze hasn’t kicked in yet, manually runANALYZEto refresh stale statistics. - Increase Statistics Target: If estimates remain inaccurate after analyzing, try raising the column’s statistics target from 100 to 1000 or even up to 10000.
- Create Extended Statistics: If misestimations involve two or more correlated columns, create extended statistics for those columns.
- Rewrite Query Logic: If all statistical investigations fail to yield performance gains, consider rewriting the SQL query or looking for alternative optimization methods.
Conclusion
“The query planner is only as smart as the statistics you feed it.”
Developers must ensure that statistics remain accurate and within reasonable ranges. Running ANALYZE regularly serves as the fundamental and most effective key to optimizing PostgreSQL query performance.
Reference
pg_stats: How Postgres Internal Stats Work