
By John Doe September 28, 2026
Summary: This report presents comprehensive sysbench OLTP benchmark results for the latest PostgreSQL 18.6 release. Tests span 3 buffer pool tiers (2GB, 12GB, 32GB) and 6 concurrency levels (4 to 256 threads).
Table of Contents
Test Environment & Infrastructure
Hardware & Host Configuration
Hardware configuration of the host:
| Component | Specification |
|---|---|
| Architecture | x86-64 |
| ECS Instance Type | Huawei Cloud General Computing Plus, c9.8xlarge.4 (32vCPU 128GB), c9.4xlarge.4 (16vCPU 64GB) |
| Storage | General Purpose SSD v2, Capacity 200GB, IOPS 100000, Throughput 1000 MB/s |
Software Configuration:
| Component | Specification |
|---|---|
| Operating System | Rocky Linux 9.6 64-bit |
| Kernel Version | 5.14.0-570.17.1 |
| PostgreSQL Version | 18.6 |
| Benchmarking Tool | sysbench 1.1.0, with LuaJIT 2.1.0-beta3 |
| PostgreSQL Client | psql (used for version detection and configuration validation) |
| Monitoring Tool | nmon (collected every second during tests) |
Buffer Pool Tiers
With the database size of 24G, three InnoDB buffer pool sizes were tested, each representing a distinct workload characteristic:
| Tier | Shared Buffer Size | Workload Character |
|---|---|---|
| 2 GB | 2 GB | I/O bound — dataset substantially exceeds buffer pool (1:12); heavy read amplification |
| 12 GB | 12 GB | Mixed — partial dataset fits in memory (1:2); realistic production scenario |
| 32 GB | 32 GB | In-memory — full working set fits; CPU and locking are primary bottlenecks |
Additionally, the WAL log space was adjusted according to the actual shared_buffers size. This ensures that checkpoints consistently trigger at fixed time intervals.
Database Configuration
The schema contains 20 tables with 5M rows in each one adding up to 100M rows.
The size of the database files on the disk is 24G.
A common configuration was applied to all engines to ensure fairness. The buffer pool specifications were layered on top
| Parameter | Value | Configuration Note |
|---|---|---|
| max_connections | 1000 | Reserved sufficient connections, above max 256 test threads. |
| logging_collector | on | Enable the logging collector. |
Test Steps
Create the test database “bench”:
createdb bench
Use the sysbench command to load test data into the “bench” database:
sysbench oltp_read_write \
--tables=20 \
--table_size=5000000 \
--pgsql-user=postgres \
--pgsql-db=bench \
prepare
After loading the test data, vacuum the “bench” database:
vacuumdb bench
Run the performance benchmark test:
sysbench oltp_read_write \
--pgsql-user=postgres \
--pgsql-db=bench \
--tables=20 \
--table_size=5000000 \
--threads=128 \
--time=600 \
--report-interval=10 \
run
Note: The first run is a warmup phase and is not recorded as formal test result data.
Test Results
The TPS (Transactions Per Second) metrics collected below represent the number of transactions processed by the database per second. In the Sysbench read-write testing model, a single transaction contains 20 query statements, so the Queries Per Second (QPS) processed by the database is approximately 20 times the TPS.
Scenario 1: In-Memory
Instance Type: c9.8xlarge.4 (32vCPU 128GB)
Database Parameter Configuration:
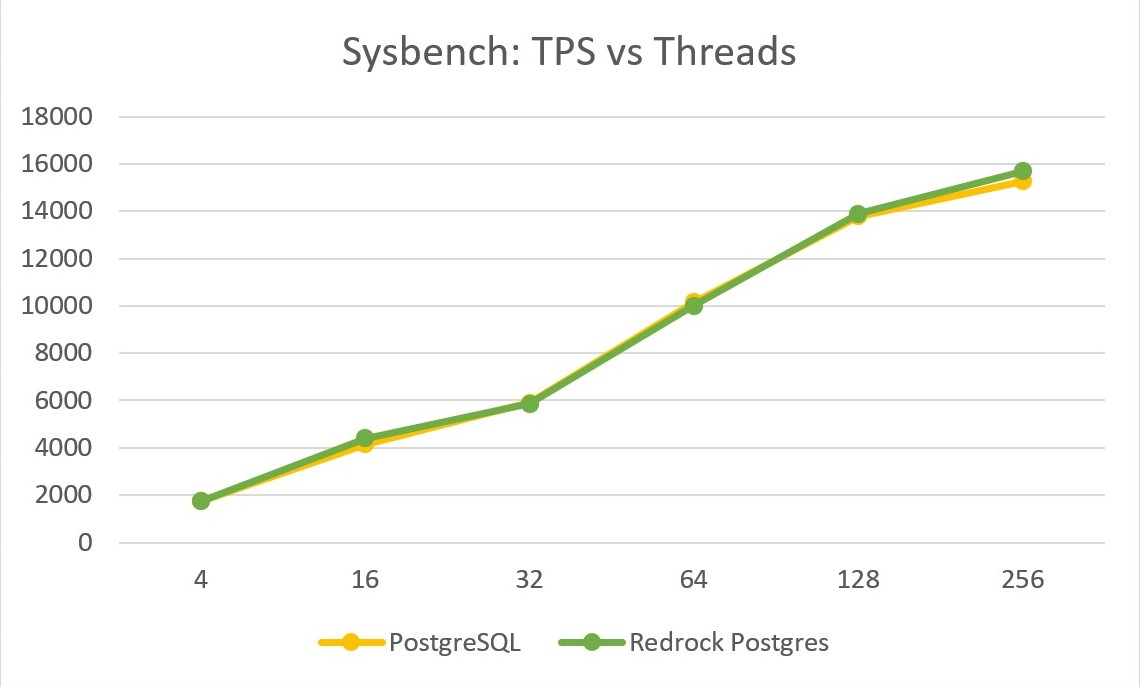
shared_buffers = 32GB
max_wal_size = 32GB
min_wal_size = 4GB
| Sysbench Threads | TPS (PostgreSQL) | TPS (Redrock Postgres) |
|---|---|---|
| 4 | 1752.42 | 1742.26 |
| 16 | 4150.17 | 4404.45 |
| 32 | 5905.28 | 5854.78 |
| 64 | 10144.89 | 10011.48 |
| 128 | 13793.44 | 13895.51 |
| 256 | 15260.80 | 15685.06 |
Scenario 2: Mixed
Instance Type: c9.4xlarge.4 (16vCPU 64GB)
Database Parameter Configuration:
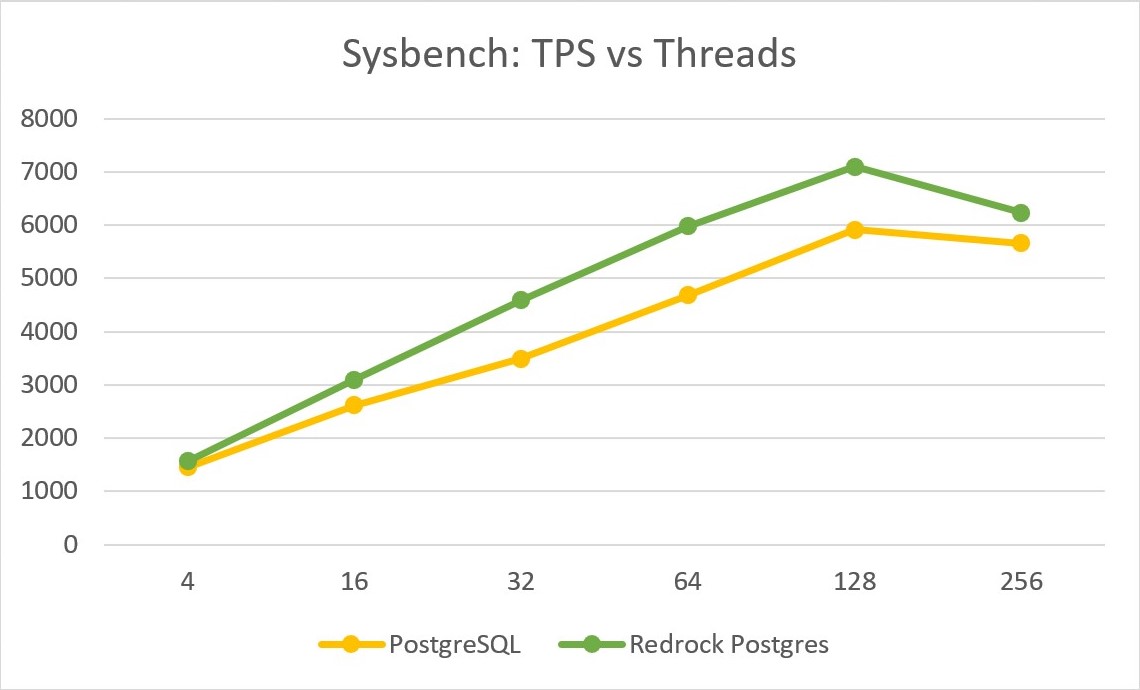
shared_buffers = 12GB
max_wal_size = 12GB
min_wal_size = 2GB
| Sysbench Threads | TPS (PostgreSQL) | TPS (Redrock Postgres) |
|---|---|---|
| 4 | 1452.00 | 1567.00 |
| 16 | 2611.87 | 3097.21 |
| 32 | 3488.18 | 4589.56 |
| 64 | 4682.07 | 5980.58 |
| 128 | 5916.14 | 7093.96 |
| 256 | 5662.79 | 6229.91 |
Scenario 3: I/O Bound
Instance Type: c9.4xlarge.4 (16vCPU 64GB)
Database Parameter Configuration:
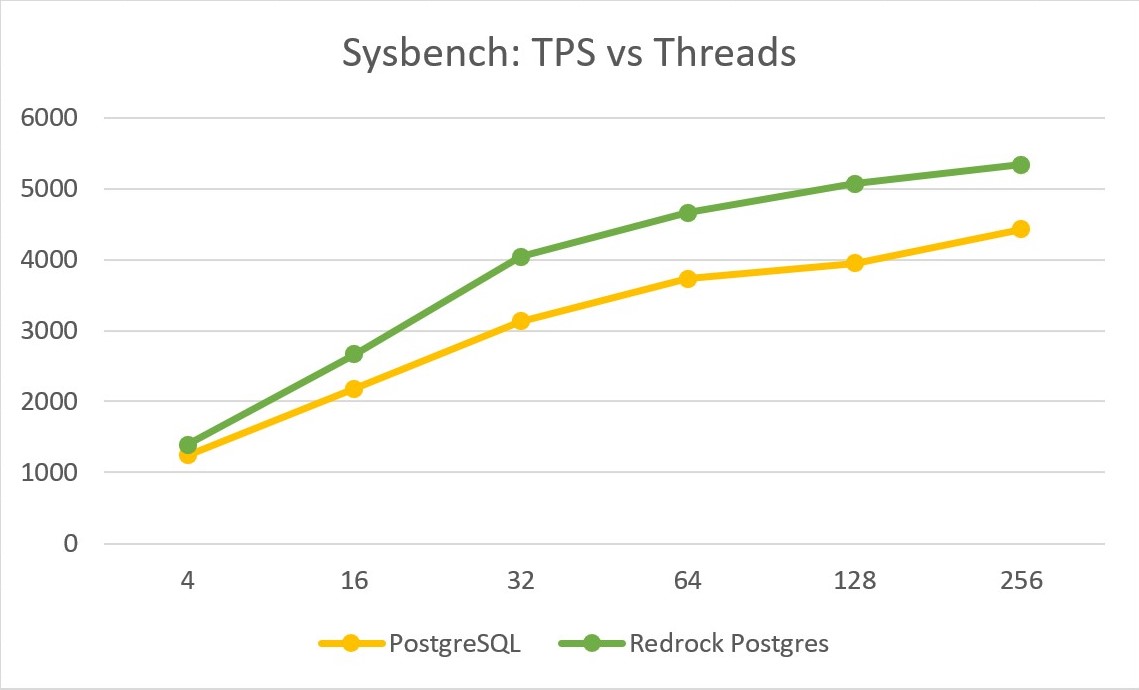
shared_buffers = 2GB
max_wal_size = 2GB
min_wal_size = 256MB
| Sysbench Threads | TPS (PostgreSQL) | TPS (Redrock Postgres) |
|---|---|---|
| 4 | 1243.74 | 1391.79 |
| 16 | 2180.26 | 2668.91 |
| 32 | 3128.07 | 4038.71 |
| 64 | 3730.14 | 4662.09 |
| 128 | 3950.43 | 5071.72 |
| 256 | 4427.00 | 5336.35 |